| ")
document.writeln("
|
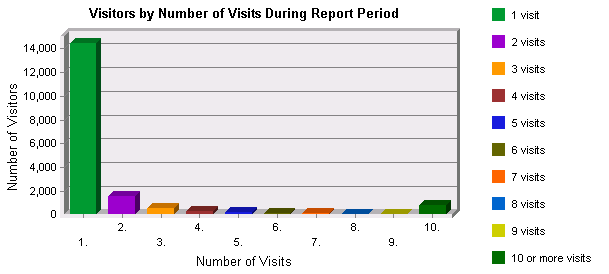
| This section shows the distribution of visitors based on how many times each visitor visited your site. |
| ")
document.writeln("
| ")
document.writeln("||||||||||||||||||||||||||||||||||||||||||
|
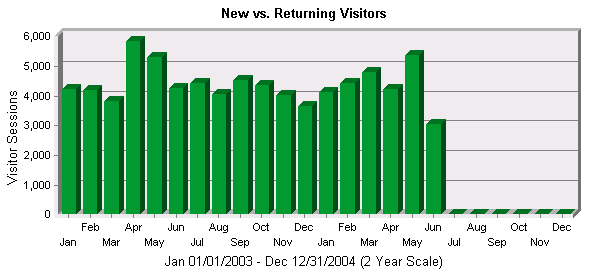
| This section shows the number of first-time visitors to your site and the number of returning visitors to your site. Only visitors identified by cookies are counted. First-time visitors are those who didn't have a cookie on their 1st hit, but had one on later hits. Returning visitors are those who already had a cookie on their 1st hit (their previous visit happened before the start of this report period.) |
| ")
document.writeln("
| ")
document.writeln("|||||||||||||||
| ")
document.writeln("
|
| This section identifies the IP address and/or domain name and their relative activity level on the site. If you do not use WebTrends cookies to track sessions on the site, WebTrends cannot differentiate between hits from different visitors of a same IP. |
| ")
document.writeln("||||||||||||||||||||||||||||||||||||||||||||||||||||||||||||||||||||||||||||||||||||||||||||||||||||||||||||||||||||||||||||||
| ")
document.writeln("
|
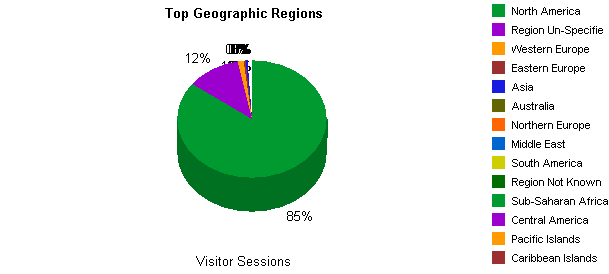
| This section identifies the top locations of the visitors to the site by geographic region. The geographic region of the visitor is determined by the suffix of their domain name. Use this information carefully because this information is based on where the domain name of the visitor is registered, and may not always be an accurate identifier of the actual geographic location of this visitor. For example, while a vast majority of .com domain names are from North America, there is a small minority of domain names that exist outside of North America. |
| ")
document.writeln("
| ")
document.writeln("|||||||||||||||||||||||||||||||||||||||||||||||||||||||||
| ")
document.writeln("
|
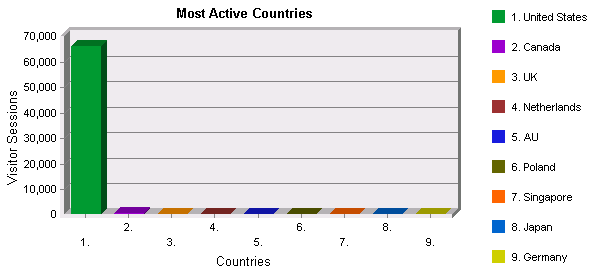
| This section identifies the top locations of the visitors to the site by country. The country of the visitor is determined by the suffix of their domain name. Use this information carefully because this information is based on where the domain name of the visitor is registered, and may not always be an accurate identifier of the actual geographic location of this visitor. For example, while a vast majority of .com domain names are from the United States, there is a small minority of domain names that exist outside of the United States. |
| ")
document.writeln("
| ")
document.writeln("|||||||||||||||||||||||||||||||||||||||||||||||||||||||||||||||||||||||||||
| ")
document.writeln("
|
| This section breaks down web site activity to show which of the North American States and Provinces were the most active on the site. This information is based on where the domain name of the visitor is registered, and may not always be an accurate representation of the actual geographic location of this visitor. This information can only be displayed if reverse DNS lookups have been performed. |
| ")
document.writeln("
| ")
document.writeln("|||||||||||||||||||||||||||||||||||||||||||||||||||||||||||||||||||||||||||
| ")
document.writeln("
|
| This section further breaks down the site's activity to show which cities were the most active on the site. This information is based on where the domain name of the visitor is registered, and may not always be an accurate representation of the actual geographic location of this visitor. This information can only be displayed if reverse DNS lookups have been performed. |
| ")
document.writeln("
| ")
document.writeln("|||||||||||||||||||||||||||||||||||||||||||||||||||||||||||||||||||||||||||
| ")
document.writeln("
|
|
The threshold set for this section in the "Limit Memory Usage" dialog was reached. Results shown in tables and graphs do not reflect the entire contents of the log file(s). This section identifies the companies or organizations that accessed the site the most often. |
| ")
document.writeln("
| ")
document.writeln("||||||||||||||||||||||||||||||||||||||||||||||||||||||||||||||||||||||||||||||||||||||||||||||||||||||||||||||||||||||||||||||
| ")
document.writeln("
|
| This section provides a breakdown by types of organizations (.com, .net, .edu, .org, .mil, and .gov.) This information can only be displayed if reverse DNS lookups have been performed, and the percentages refer to the total of hits for which the organization type can be determined (some IPs cannot be resolved to a domain, and therefore an organization type cannot be determined). |
| ")
document.writeln("
| ")
document.writeln("|||||||||||||||||||||||||||||||||||||||||||||||||||||||||||||
| ")
document.writeln("
This report was generated by WebTrends.